
Learning Action Map and Learning Outcomes
Learning Action Map
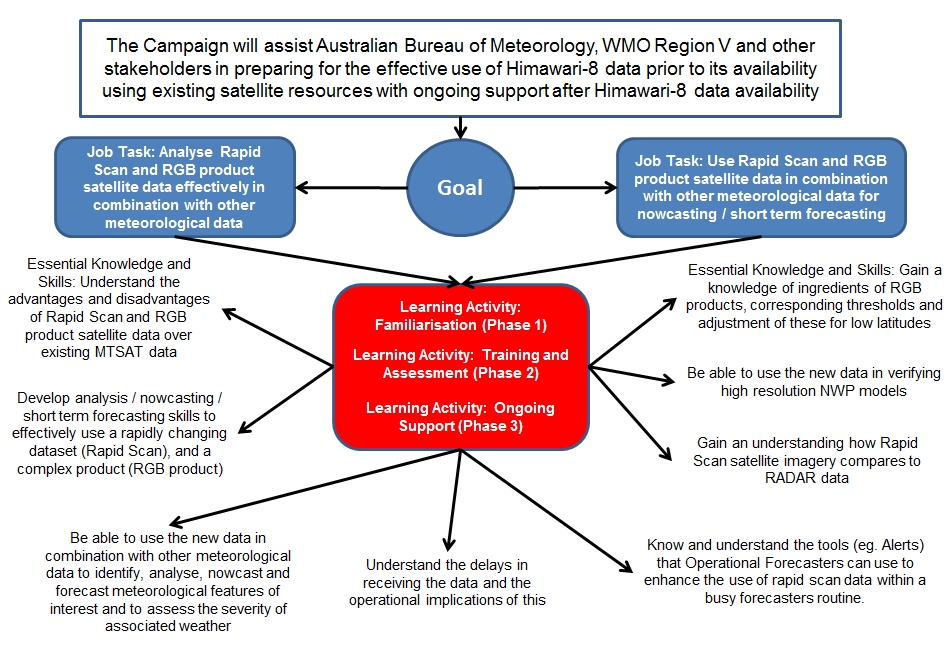
Accessible version of the schematic view
Learning Outcomes
The titles of the Familiarisation Resources are mapped against the underpinning Learning Outcomes, WMO-1083 Capabilities and BOM Enabling Skills in the table below. Components of the WMO-1083 Capabilities and BOM Enabling Skills covered in these Resources are highlighted in bold.
|
Familiarisation Resource Title |
Underpinning Learning Outcomes, WMO-1083 Capabilities and BOM Enabling Skills |
|
Forecaster Feedback on the use of Rapid Scan Data (Part A) |
At the end of this exercise you will:
|
|
WMO 1083 2.3.3 – Monitor and observe the weather situation, and use real-time or historic data, including satellite and radar data, to prepare analyses and basic forecasts; WMO 1083 2.3.3.4 – Interpreting satellite imagery: Interpret satellite images, including use of common wavelengths (infrared, visible, water vapour and near infrared) and enhancements and animated imagery, to identify cloud types and patterns, synoptic and mesoscale systems, and special features (fog, sand, volcanic ash, dust, fires, etc.); WMO 1083 2.3.3.2 – Tropical cyclones: Apply physical and dynamical reasoning to explain the structure and characteristics of tropical cyclones, the main dynamical processes involved in their development, and the techniques used to forecast the development and evolution of tropical storms; WMO 1083 2.3.3.3 – Convective systems: Apply physical and dynamical reasoning to explain the structure and formation of isolated convective systems such as thunderstorms and convective storms (including single cell, multicell and supercell storms); |
|
|
Enabling Skills Document Element 2, Performance Component 2 - Identify Cumulonimbus clouds, their intensity and their stage of development. Enabling Skills Document Element 3, Performance Component 2 - Anticyclones and cyclones (including rapid cyclogenesis), including tropical cyclones and depressions, extratropical and polar lows and cyclones, at upper and lower levels Enabling Skills Document Element 3, Performance Component 3 - Convective cells and cloud systems (including pulse convection, multicells, supercells, squall lines, mesoscale convective complexes and systems) and associated mesoscale features including outflow boundaries and storm top features. Mesoscale boundaries and interactions, dry lines Enabling Skills Document Element 4, Skills, Performance component pertaining to "Volcanic Ash particulates" |
|
|
Forecaster Feedback on the use of Rapid Scan Data (Part B) |
At the end of this exercise you will:
|
|
WMO 1083 2.3.3 – Monitor and observe the weather situation, and use real-time or historic data, including satellite and radar data, to prepare analyses and basic forecasts; WMO 1083 2.3.3.4 – Interpreting satellite imagery: Interpret satellite images, including use of common wavelengths (infrared, visible, water vapour and near infrared) and enhancements and animated imagery, to identify cloud types and patterns, synoptic and mesoscale systems, and special features (fog ??, sand, volcanic ash, dust, fires, etc.);WMO 1083 2.3.2.2 - Strengths and weaknesses of NWP: Assess the strengths and weaknesses of NWP and the reasons why there are limits to atmospheric predictability; |
|
|
Enabling Skills Document Element 4, Performance component pertaining to "Fire and Smoke" |
|
|
Forecaster use of Rapid Scan Data (part A)
|
At the end of this exercise you will:
|
|
WMO 1083 2.3.3 – Monitor and observe the weather situation, and use real-time or historic data, including satellite and radar data, to prepare analyses and basic forecasts; WMO 1083 2.3.3 - Describe service delivery in terms of the nature, use and benefits of the key products and services, including warnings and assessment of weather-related risks. WMO 1083 2.3.3.3 – Convective systems: Apply physical and dynamical reasoning to explain the structure and formation of isolated convective systems such as thunderstorms and convective storms (including single cell, multicell and supercell storms); WMO 10832.3.3.5 – Forecast process: Describe the main components of the forecast process, including observation, analysis, diagnosis, prognosis, product preparation, product delivery and product verification; |
|
|
Enabling Skills Document Element 2, Performance Component 2 - Identify Cumulonimbus clouds, their intensity and their stage of development. Enabling Skills Document Element 3, Performance Component 3 - Convective cells and cloud systems (including pulse convection, multicells, supercells, squall lines, mesoscale convective complexes and systems) and associated mesoscale features including outflow boundaries and storm top features. |
|
|
Forecaster use of Rapid Scan Data (part B) |
At the end of this exercise you will:
|
|
WMO 1083 2.3.3 – Monitor and observe the weather situation, and use real-time or historic data, including satellite and radar data, to prepare analyses and basic forecasts; WMO 1083 2.3.3.4 – Integrating conventional and remote-sensing data: Integrate remote-sensing data and synoptic observations to identify synoptic and mesoscale systems and diagnose the weather situation through relating features found in radar and satellite imagery to features observed from other data sources; |
|
|
No Enabling Skill for this topic |
|
|
Forecaster use of Rapid Scan Data (part C) |
At the end of this exercise you will:
|
|
WMO 1083 2.3.3 – Monitor and observe the weather situation, and use real-time or historic data, including satellite and radar data, to prepare analyses and basic forecasts; WMO 1083 2.3.3.4 – Interpreting satellite imagery: Interpret satellite images, including use of common wavelengths (infrared, visible, water vapour and near infrared) and enhancements and animated imagery, to identify cloud types and patterns, synoptic and mesoscale systems, and special features (fog, sand, volcanic ash, dust, fires, etc.) WMO 1083 2.3.3 - Describe service delivery in terms of the nature, use and benefits of the key products and services, including warnings and assessment of weather-related risks. |
|
|
Enabling Skills Document Element 2, Performance Component 2 - Identify Cumulonimbus clouds, their intensity and their stage of development. Enabling Skills Document Element 3, Performance Component 3 - Convective cells and cloud systems (including pulse convection, multicells, supercells, squall lines, mesoscale convective complexes and systems) and associated mesoscale features including outflow boundaries and storm top features. |
|
|
Broadscale Case Study (Japan) |
At the end of this exercise you will:
|
|
WMO 1083 2.3.3 – Monitor and observe the weather situation, and use real-time or historic data, including satellite and radar data, to prepare analyses and basic forecasts; WMO 1083 2.3.3.4 – Interpreting satellite imagery: Interpret satellite images, including use of common wavelengths (infrared, visible, water vapour and near infrared) and enhancements and animated imagery, to identify cloud types and patterns, synoptic and mesoscale systems, and special features (fog, sand, volcanic ash, dust, fires, etc.); |
|
|
Enabling Skills Document Element 2, Performance Component 2 - Identify cumulonimbus clouds, their intensity and stage of development. Enabling Skills Document Element 2, Performance Component 3 - Identify fogs and discriminate between fog and low cloud Enabling Skills Document Element 3, Performance Component 2 - Jet streams, convergence and frontal zones, conveyor belts Enabling Skills Document Element 3, Performance Component 2 - Anticyclones and cyclones (including rapid cyclogenesis), including tropical cyclones and depressions, extratropical and polar lows and cyclones, at upper and lower levels Enabling Skills Document Element 4, Skills, Performance component pertaining to "Features indicating regions of turbulence (clear air turbulence)" |
|
|
Rapid Scan vs RADAR (Gippsland region, Australia) |
At the end of this exercise you will:
|
|
WMO 1083 2.3.3 – Monitor and observe the weather situation, and use real-time or historic data, including satellite and radar data, to prepare analyses and basic forecasts; WMO 1083 2.3.3.4 – Interpreting radar data: Interpret common radar displays, including use of enhancements and animated imagery, to identify features associated with convective and mesoscale processes; WMO 1083 2.3.3.4 – Interpreting satellite imagery: Interpret satellite images, including use of common wavelengths (infrared, visible, water vapour and near infrared) and enhancements and animated imagery, to identify cloud types and patterns, synoptic and mesoscale systems, and special features (fog, sand, volcanic ash, dust, fires, etc.); |
|
|
Enabling Skills Document Element 2, Performance Component 2 - Identify cumulonimbus clouds, their intensity and stage of development. Enabling Skills Document Element 3, Performance Component 3 - Convective cells and cloud systems (including pulse convection, multicells, supercells, squall lines, mesoscale convective complexes and systems) and associated mesoscale features including outflow boundaries and storm top features. Enabling Skills Document Element 4, Performance Component pertaining to "Fires and Smoke" |
|
|
Diurnal Tropical Convection (Java, Indonesia) |
At the end of this exercise you will:
|
|
WMO 1083 2.3.3 – Monitor and observe the weather situation, and use real-time or historic data, including satellite and radar data, to prepare analyses and basic forecasts; WMO 1083 2.3.3.4 – Interpreting satellite imagery: Interpret satellite images, including use of common wavelengths (infrared, visible, water vapour and near infrared) and enhancements and animated imagery, to identify cloud types and patterns, synoptic and mesoscale systems, and special features (fog, sand, volcanic ash, dust, fires, etc.); |
|
|
Enabling Skills Document Element 2, Performance Component 2 - Identify cumulonimbus clouds, their intensity and stage of development. Enabling Skills Document Element 2, Performance Component 3 - Identify fogs and discriminate between fog and low cloud |
|
|
Monsoon Squall Lines (Arafura Sea, Australia) |
At the end of this exercise you will:
|
|
WMO 1083 2.3.3 – Monitor and observe the weather situation, and use real-time or historic data, including satellite and radar data, to prepare analyses and basic forecasts; Yes – radar superposition on image WMO 1083 2.3.3.4 – Interpreting satellite imagery: Interpret satellite images, including use of common wavelengths (infrared, visible, water vapour and near infrared) and enhancements and animated imagery, to identify cloud types and patterns, synoptic and mesoscale systems, and special features (fog, sand, volcanic ash, dust, fires, etc.); WMO 1083 2.3.3.2 – Extreme weather: Describe the weather, with emphasis on any extreme or hazardous conditions that might be associated with tropical weather systems (including tropical cyclones and monsoons) and the likely impact of such conditions; WMO 1083 2.3.3.4 (maybe not here…) – Integrating conventional and remote-sensing data: Integrate remote-sensing data and synoptic observations to identify synoptic and mesoscale systems and diagnose the weather situation through relating features found in radar and satellite imagery to features observed from other data sources; |
|
|
Enabling Skills Document Element 3, Performance Component 1 - Intertropical convergence zones, monsoon and trade wind regimes Enabling Skills Document Element 2, Performance Component 2 - Identify cumulonimbus clouds, their intensity and stage of development. |
|
|
Turbulence Signatures over Honshu (Japan) |
At the end of this exercise you will:
|
|
WMO 1083 2.3.3 – Monitor and observe the weather situation, and use real-time or historic data, including satellite and radar data, to prepare analyses and basic forecasts; WMO 1083 2.3.3.4 – Interpreting satellite imagery: Interpret satellite images, including use of common wavelengths (infrared, visible, water vapour and near infrared) and enhancements and animated imagery, to identify cloud types and patterns, synoptic and mesoscale systems, and special features (fog, sand, volcanic ash, dust, fires, etc.); WMO 1083 2.3.3.3 – Orographic mesoscale phenomena: Apply physical and dynamical reasoning to explain the structure and formation of orographic mesoscale phenomena (lee waves, rotors, up-slope and down-slope winds, valley winds, gap flows, lee lows, etc.); WMO 1083 2.3.1.2 - Thermodynamic diagrams: Use a thermodynamic diagram to analyse atmospheric processes, including assessing atmospheric stability, determining common parameters used to describe the state of the atmosphere (including cloud parameters), and interpreting the key features of a sounding; WMO 1083 2.3.3.4 – Integrating conventional and remote-sensing data: Integrate remote-sensing data and synoptic observations to identify synoptic and mesoscale systems and diagnose the weather situation through relating features found in radar and satellite imagery to features observed from other data sources; WMO 1083 2.3.3.1 - Jet streaks and jet stream: Apply physical and dynamical reasoning to explain the development, structure and impact of jet streaks and the relationship between the jet stream and the development of mid-latitude depressions; |
|
|
Enabling Skills Document Element 3, Performance component 3 pertaining to "Gravity Waves" Enabling Skills Document Element 4, Skills, Performance component pertaining to "Features indicating regions of turbulence (clear air turbulence)" |
|
|
Turbulence Signatures over Queensland (Australia) |
At the end of this exercise you will:
|
|
WMO 1083 2.3.3 – Monitor and observe the weather situation, and use real-time or historic data, including satellite and radar data, to prepare analyses and basic forecasts; WMO 1083 2.3.3.4 – Interpreting satellite imagery: Interpret satellite images, including use of common wavelengths (infrared, visible, water vapour and near infrared) and enhancements and animated imagery, to identify cloud types and patterns, synoptic and mesoscale systems, and special features (fog, sand, volcanic ash, dust, fires, etc.); WMO 1083 2.3.3.1 - Jet streaks and jet stream: Apply physical and dynamical reasoning to explain the development, structure and impact of jet streaks and the relationship between the jet stream and the development of mid-latitude depressions; |
|
|
Enabling Skills Document Element 4, Performance component pertaining to "Features indicating regions of turbulence (clear air turbulence)" Enabling Skills Document Element 3, Performance component 2 pertaining to "Jet Streams, convergence and frontal zones, conveyor belts " |
|
|
Fog and Low Cloud (South Australia) |
At the end of this exercise you will:
|
|
WMO 1083 2.3.3 – Monitor and observe the weather situation, and use real-time or historic data, including satellite and radar data, to prepare analyses and basic forecasts; WMO 1083 2.3.3.4 – Interpreting satellite imagery: Interpret satellite images, including use of common wavelengths (infrared, visible, water vapour and near infrared) and enhancements and animated imagery, to identify cloud types and patterns, synoptic and mesoscale systems, and special features (fog, sand, volcanic ash, dust, fires, etc.); |
|
|
Enabling Skills Document Element 2, Performance Component 3 - Identify fogs and discriminate between fog and low cloud |
|
|
Smoke and Fire (Victoria, Australia) |
At the end of this exercise you will:
|
|
WMO 1083 2.3.3 – Monitor and observe the weather situation, and use real-time or historic data, including satellite and radar data, to prepare analyses and basic forecasts; WMO 1083 2.3.3.4 – Interpreting satellite imagery: Interpret satellite images, including use of common wavelengths (infrared, visible, water vapour and near infrared) and enhancements and animated imagery, to identify cloud types and patterns, synoptic and mesoscale systems, and special features (fog, sand, volcanic ash, dust, fires, etc.); |
|
|
Enabling Skills Document Element 4, Skills, Performance component pertaining to "Fires and Smoke" |
|
|
Introduction to Red-Green-Blue (RGB) products |
At the end of this exercise you will:
|
|
WMO 1083 2.3.3 - Describe service delivery in terms of the nature, use and benefits of the key products and services, including warnings and assessment of weather-related risks. |
|
|
No Enabling Skill for this topic |
|
|
Introduction to the Dust RGB product (China / Sudan). |
At the end of this exercise you will:
|
|
WMO 1083 2.3.3.4 – Interpreting satellite imagery: Interpret satellite images, including use of common wavelengths (infrared, visible, water vapour and near infrared) and enhancements and animated imagery, to identify cloud types and patterns, synoptic and mesoscale systems, and special features (fog, sand, volcanic ash, dust, fires, etc.); |
|
|
Enabling Skills Document: Element 4, Performance Component "Dust and sandstorms and plumes and areas of raised dust" |
|
|
Introduction to the Volcanic Ash RGB product (Indonesia) |
At the end of this exercise you will:
|
|
WMO 1083 2.3.3.4 – Interpreting satellite imagery: Interpret satellite images, including use of common wavelengths (infrared, visible, water vapour and near infrared) and enhancements and animated imagery, to identify cloud types and patterns, synoptic and mesoscale systems, and special features (fog, sand, volcanic ash, dust, fires, etc.); |
|
|
Enabling Skills Document: Element 4, Performance Component "Volcanic Ash particulates and chemical emissions" |
|
|
Introduction to the Airmass RGB product (Southern Atlantic / western Europe) |
At the end of this exercise you will:
|
|
WMO 1083 2.3.3.4 – Interpreting satellite imagery: Interpret satellite images, including use of common wavelengths (infrared, visible, water vapour and near infrared) and enhancements and animated imagery, to identify cloud types and patterns, synoptic and mesoscale systems, and special features (fog, sand, volcanic ash, dust, fires, etc.); WMO 1083 2.3.1.5 - Passive sensing systems: Explain how passive sensing systems are used to provide digital data (such as visible, near infrared, infrared and water vapour imagery channels) and derived information about surface temperature and lightning, and atmospheric properties (including temperature, humidity, wind and atmospheric constituents); |
|
|
No Enabling Skill for this topic |
|
|
Introduction to the Severe Storm RGB (Africa / Spain) |
At the end of this exercise you will:
|
|
WMO 1083 2.3.3.4 – Interpreting satellite imagery: Interpret satellite images, including use of common wavelengths (infrared, visible, water vapour and near infrared) and enhancements and animated imagery, to identify cloud types and patterns, synoptic and mesoscale systems, and special features (fog, sand, volcanic ash, dust, fires, etc.); WMO 1083 2.3.3.3 - Extreme weather: Describe the weather, with emphasis on any extreme or hazardous conditions that might be associated with convective and mesoscale phenomena, and the likely impact of such conditions; |
|
|
Enabling Skills Document Element 2, Performance Component 2 - Identify cumulonimbus clouds, their intensity and stage of development. Enabling Skills Document Element 2, Performance Component 7 - Discriminate between clouds with small or large cloud particles |
|
|
Adapting RGB products to low latitudes |
At the end of this exercise you will:
|
|
WMO 1083 2.3.3.2 - Weather systems: Explain how tropical weather systems differ from those in mid-latitudes and polar regions; |
|
|
No Enabling Skill for this topic |

- Date created: Fri, 09 Jan 2015
- Last modified: Thu, 22 Jan 2015 20:40:26 +0000
- Page count: 0012497
Cricos Provider Number 02015K | Disclaimer | Privacy | Accessibility