Australian VLab Centre of Excellence Blog
(with an emphasis on Himawari-8 related data developments)
Thunderstorms and upper atmospheric turbulence, MTSAT-1R rapid scan imagery, eastern Australia 22nd January 2014
Posted on June 15, 2015
(animation courtesy Japan Meteorological Agency (JMA) / Australian Bureau of Meteorology (BOM))
 CLICK ON THE IMAGE TO ANIMATE
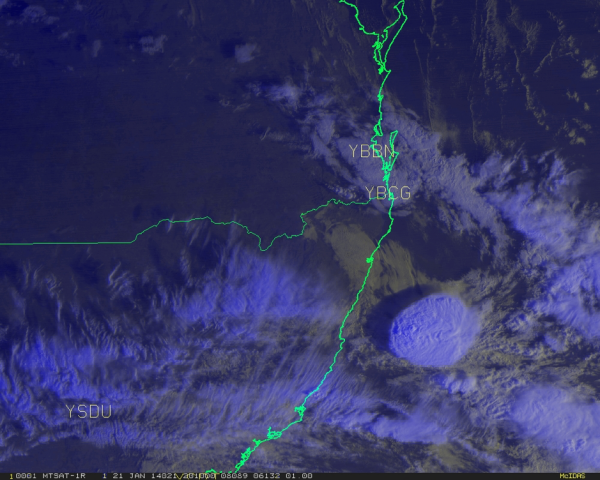
MTSAT-1R 10 minute rapid scan VIS/IR RGB product, southeast Queensland and northeastern New South Wales. Brisbane (YBBN), Coolangatta (YBCG) and Dubbo (YSDU) are annotated.
- This case study shows how thunderstorm development over the maritime region (Tasman Sea) during the early morning can be nowcast in the 10 minute MTSAT-1R satellite data by monitoring the overshooting tops.
- Thunderstorm development over land during the day is also shown by the development of cumulus, especially the clumping of cumulus and towering cumulus cloud. This post shows that this cloud development can be seen in satellite imagery before any significant precipitation signatures appear in the RADAR imagery. In this case the thunderstorms inland and to the southwest of Brisbane (YBBN) resulted in severe weather. This included hail up to 3 cm at Stanthorpe and Mutdapilly and heavy rainfall with associated flash-flooding near Gatton.
- The 10 minute rapid scan satellite data also permits the monitoring of transverse cirrus banding associated with the Subtropical Jet. This banding can sometimes correspond to significant upper air turbulence as shown in this post.
- Date created: Mon, 15 Jun 2015
- Last modified: Wed, 17 Jun 2015 05:24:37 +0000
- Page count: 0023163
© Copyright Commonwealth of Australia 2025, Bureau of Meteorology (ABN 92 637 533 532)
Cricos Provider Number 02015K | Disclaimer | Privacy | Accessibility
Cricos Provider Number 02015K | Disclaimer | Privacy | Accessibility